The Paradox
What This Case Is Actually Testing
CAMS is not just another fintech or outsourcing business. It is the record-keeper and transaction processor for India’s mutual fund industry — effectively sitting at the intersection of investor activity, AMC operations, and regulatory infrastructure. Every time an investor starts a SIP, redeems units, or updates KYC, it flows through CAMS.
The Obvious Narrative
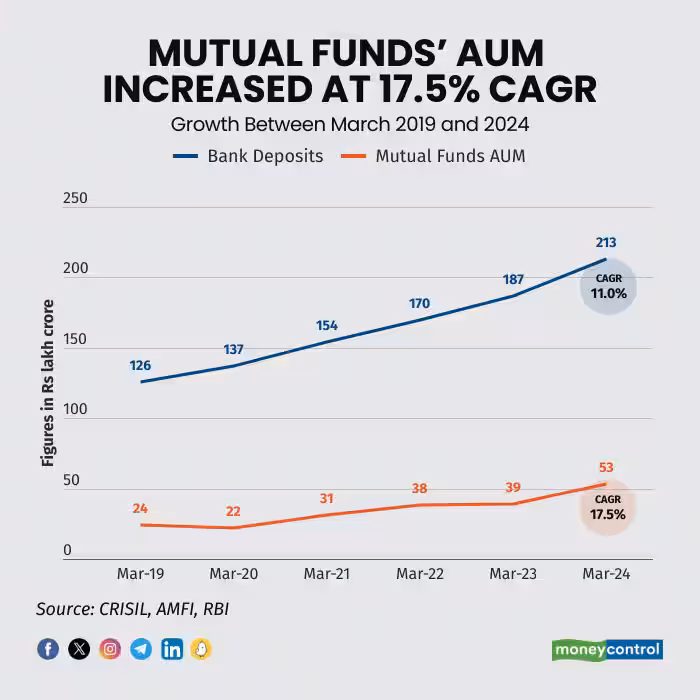
- • AUM compounding at 15–18%
- • SIP as a monthly habit (~₹30K Cr/month)
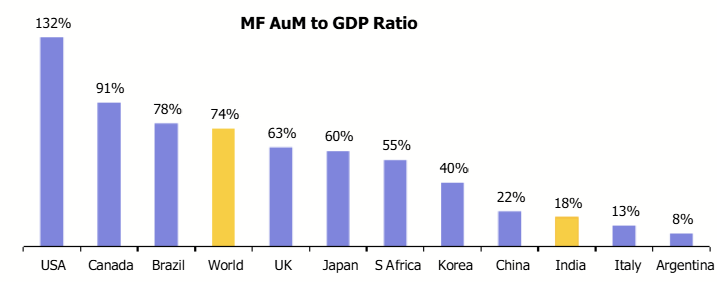
- • 20% AUM/GDP → Huge runway vs 63% Global
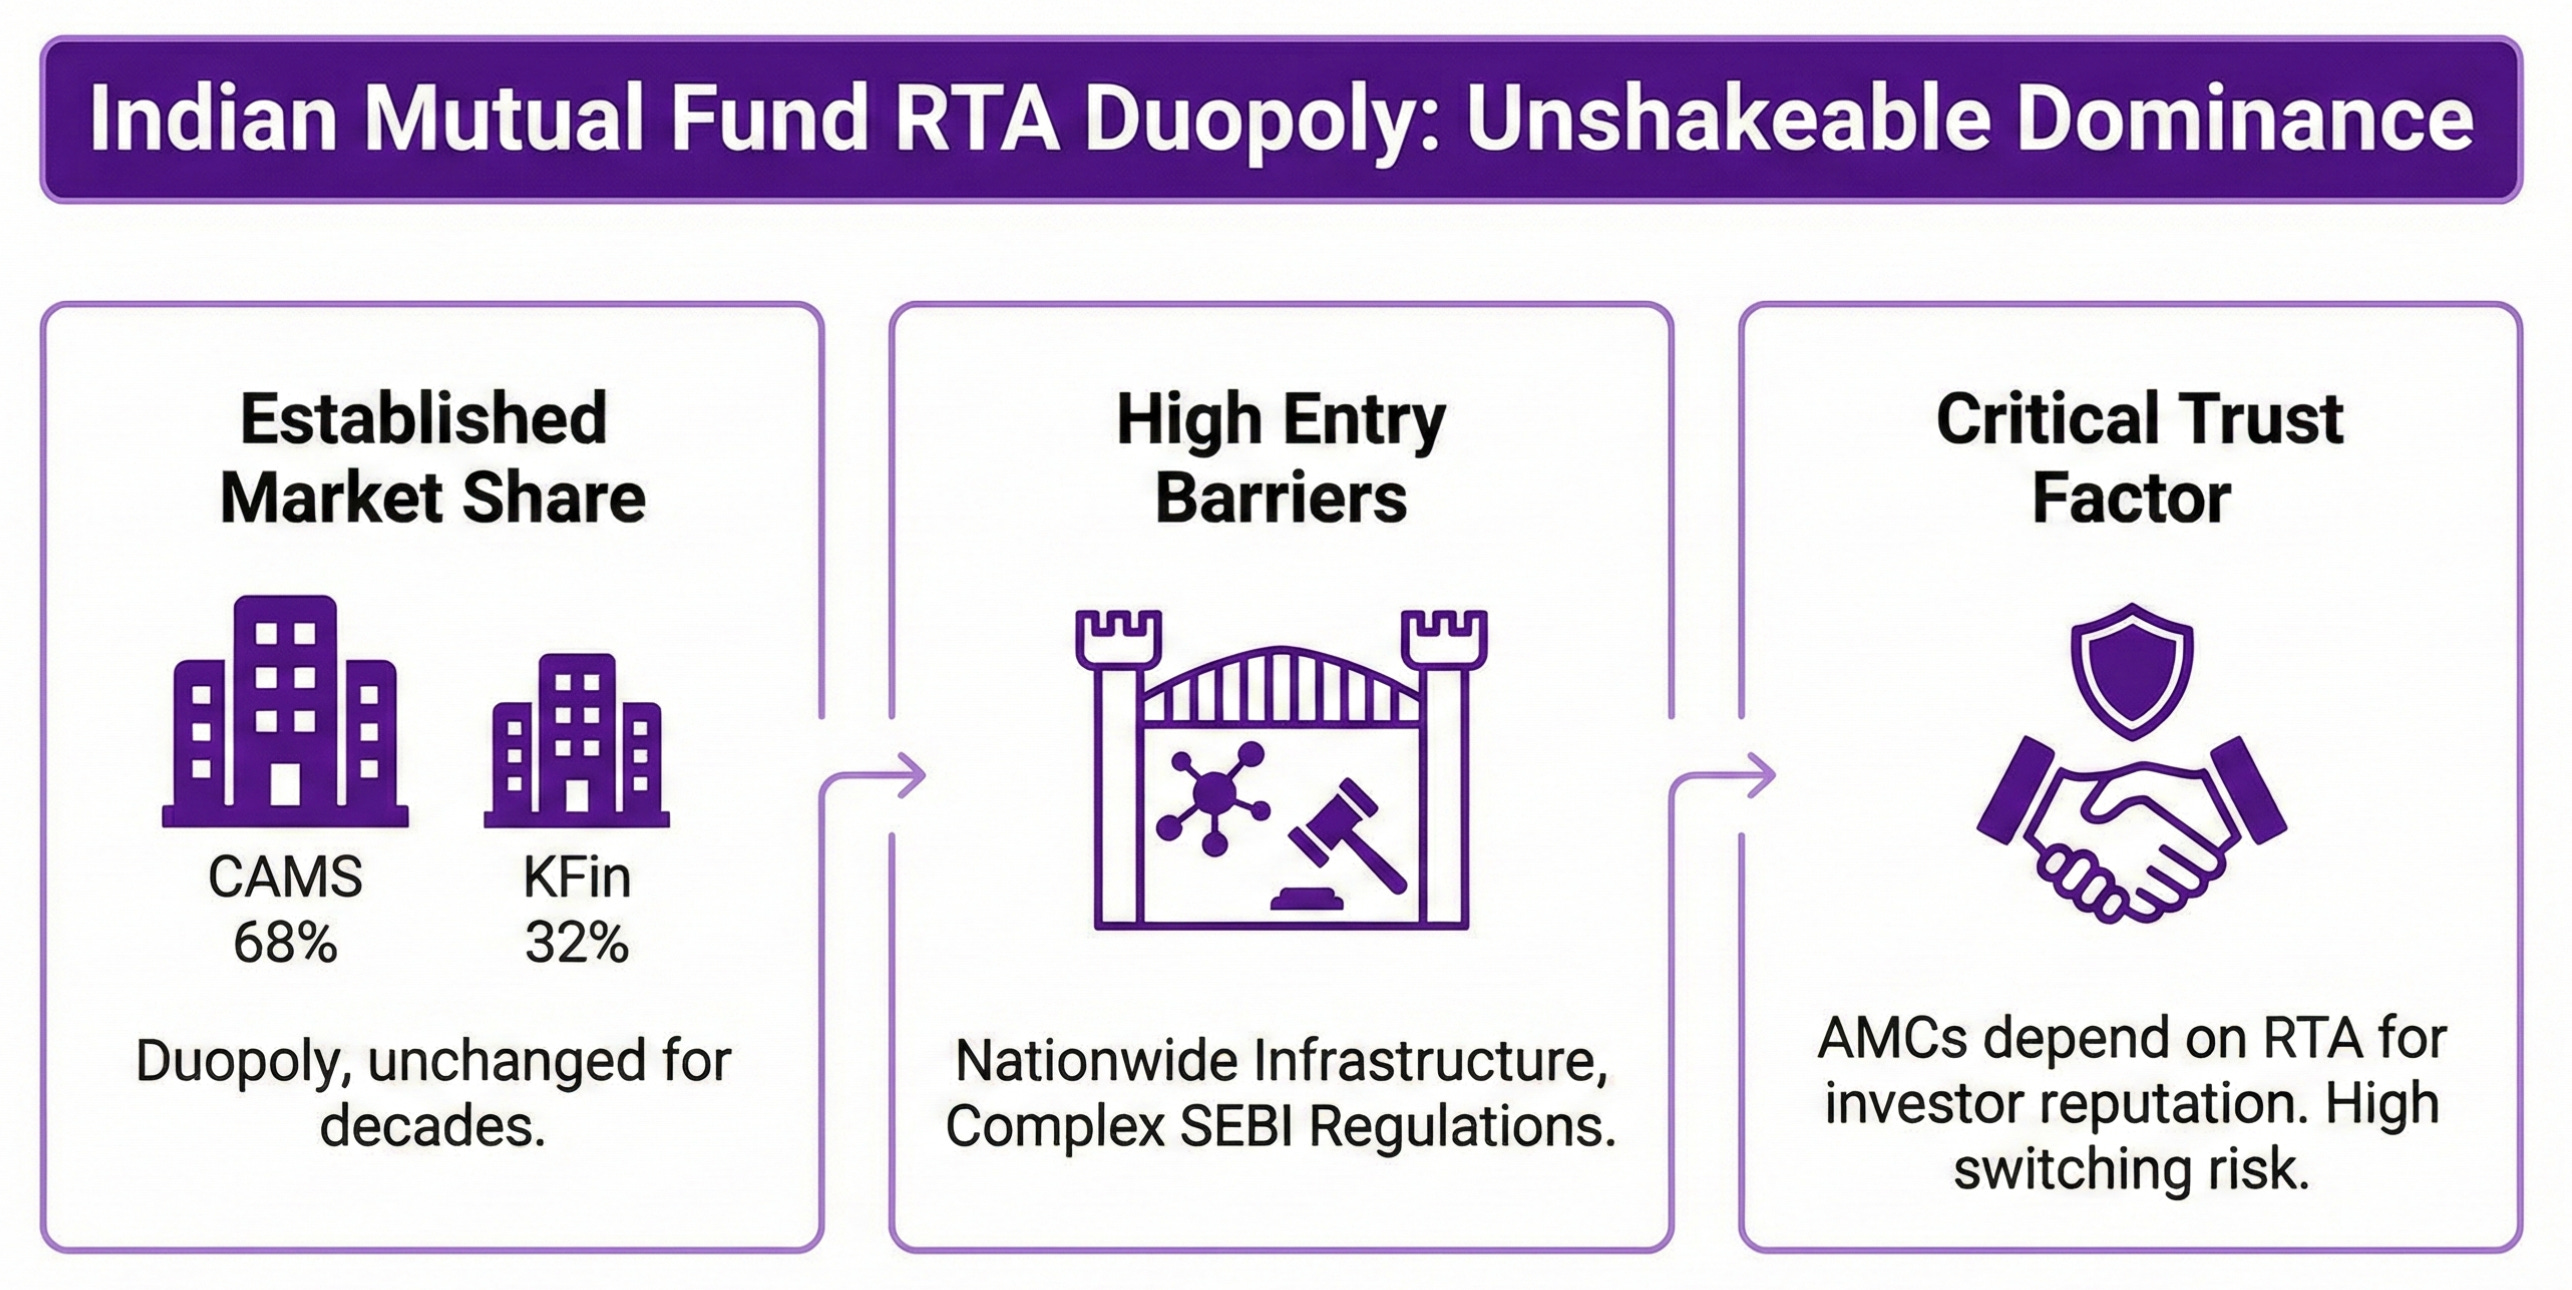
- • Dominant ~70% market share
Naive Conclusion:
“This is a compounding machine with massive operating leverage.”
“AUM compounds. CAMS monetization does not compound at the same rate.”
This case tests whether you can identify when industry growth does not equal business quality improvement.
Executive Summary
Structural Adaptation vs Growth Scaling
CAMS is not scaling like a SaaS or platform business. It is scaling like regulated infrastructure. It is not diversifying to accelerate growth, but to protect itself from structural erosion.
| Metric | Current Value / Target |
|---|---|
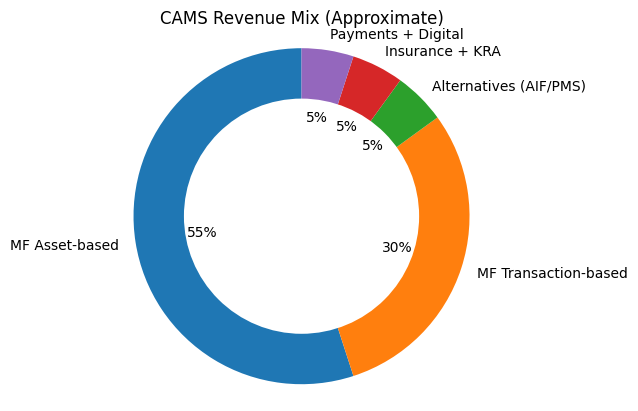
| MF Revenue Contribution | ~85–87% |
| Non-MF Revenue Contribution | ~13–15% |
| EBITDA Margin | ~44–46% |
| Market Share | ~70% |
You’re not evaluating how fast CAMS can grow; you’re evaluating how much of that growth converts into high-quality earnings.
Industry Backbone
Structural Drivers vs. Misleading Tailwinds
The mutual fund industry is genuinely strong, driven by a young population entering the earning phase, the financialization of savings, and digital distribution via platforms like Zerodha and Groww.
| Metric | Current Value | Growth Status |
|---|---|---|
| Total AUM | ₹65T → ₹75T+ | ~23% YoY Growth |
| SIP Flow | ₹29,000 Cr / Month | Habitualized Retail Saving |
| Investor Base | 5.3+ Crore | Steady Expansion |
The Critical Misread: Most investors assume CAMS is a direct beneficiary of AUM growth. CAMS benefits from activity volume, not from pricing expansion.
Revenue Engine
Volume Explosion vs. Pricing Power
REVENUE = AUM × YIELD (bps)
| Metric | Growth Magnitude | Impact |
|---|---|---|
| AUM Expansion | 2.5x – 3x | High Nominal Scale |
| Transaction Volume | ~9x | High Operational Load |
| SIP Accounts | ~3x | Habit Formation |
Operating leverage is finite. CAMS has already harvested most of it. Once technology and compliance infra costs are covered, only pricing can drive upside—and pricing is falling.
The Success Trap
Regressive Pricing Mechanism
This is not a bug; this is the business model. As CAMS grows, it handles larger AMCs who negotiate lower fees. The tiered pricing mechanism ensures that scale actually causes pricing decline.
| Year / Slab | AUM State | Yield (bps) | Observation |
|---|---|---|---|
| FY20 | ₹27T | ~0.025 | High Margin Baseline |
| FY25 | ₹75T | ~0.0234 | Structural Compression |
| FY30E | ₹150T | ~0.020 – 0.022 | Projected Floor |
| Slab: ₹10K Cr | Small AMC | ~0.030 | Premium Yield |
| Slab: ₹1L Cr+ | Giant AMC | ~0.023 | Compressed Yield |
This structural truth is not cyclical or temporary. It is built into the business model: the larger CAMS becomes, the less it earns per unit.
Regulatory Wall
The Invisible Fee Ceiling
CAMS has no independent pricing power. It inherits pressure from a regulatory chain where SEBI controls the AMC, and the AMC squeezes the vendor.
TER Caps & Passive Shift
Performance-Based TER
Segment Deep Dive
The Non-MF Expansion Strategy
CAMS is moving from monopoly-like economics in RTA to competitive economics across seven major segments. Diversification is for survival, not choice.
01. Core RTA (Mutual Fund)
High margin (~45%), Duopoly, Stable but slowing yield.The primary cash generator undergoing structural yield compression.
02. CAMSPay (Payments Infra)
₹2–₹10 per transaction. Mandate + SIP processing.High volume, moderate margin. Competes with Razorpay and NPCI infra. Crucial for STP (Straight-Through Processing).
03. Account Aggregator (CAMSfinserv)
Financial data-sharing infra. Early stage.Pure optionality; monetization remains unclear in the short term.
04. AIF / PMS Services
Closest to MF economics. High yield potential.High-value segment but currently operates at a smaller scale compared to core MF.
05. KRA (KYC)
Commodity business, low margin, purely regulatory infra.
06. Insurance Repo
Slow industry adoption, limited monetization per unit.
07. Analytics (Think360)
Data services for lenders. Early monetization stage.
Margin Trajectory
Mathematical Constraints of Inevitable Compression
Even with best-in-class execution, the mix shift toward Non-MF segments drags down the blended margin. The math of 75/25 diversification leads to a structural reset.
Blended Math (FY29 Target)
MF: 75% Mix × 45% Margin = 33.75
NON-MF: 25% Mix × 15% Margin = 3.75
TOTAL ≈ 37.5%
Risk Framework
Scenario & Impact Analysis
| Scenario | Margin Range | Strategic Reality |
|---|---|---|
| Bull Case | 42 – 44% | Best execution in Non-MF + AIF scale |
| Base Case | 40 – 42% | Most likely trajectory; controlled dilution |
| Bear Case | 35 – 38% | Aggressive yield cuts + passive dominance |
| Risk Factor | Nature | Severity |
|---|---|---|
| TER Cuts | Structural | Critical |
| Passive Shift | Structural | High |
| UPI / BBPS | Disruption | Moderate |
| AMC Consolidation | Pricing | High |
| Regulation | External | Ongoing |
Risks are not cyclical — they are structural. Stability improves with diversification, but returns compress.
Valuation
Institutional Pricing Framework
Growth CAGR
12 – 16%
Sustainable realistic target; ignore hyper-growth noise.
PE Multiple
~35x
Justified only by stability; fair value found in 20% dips.
Strategy
CORRECTION
Buy on structural pullbacks, not on momentum breakouts.
Returns = Earnings Growth + Disciplined Entry (NOT Multiple Expansion).
The Final Verdict
The Platform Trade-Off
CAMS CANNOT DIVERSIFY WITHOUT MARGIN DILUTION.
From Monopoly Margins to Platform Economics.
CAMS is not weakening; it is transitioning. The business is managing a structural shift: higher stability at the cost of lower economic quality. It is transitioning from a high-margin monopoly into a diversified infrastructure platform.
Where do you want to go next?